Examples
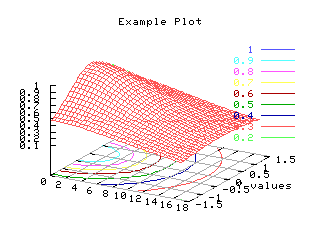
>>> x = Numeric.arange(35)/2.0
>>> y = Numeric.arange(30)/10.0 - 1.5
>>> def z(x,y): return 1.0 / (1 + 0.01 * x**2 + 0.5 * y**2)
>>> g,d = iasplot(x, y, z)
>>>
 |
|
| x, y, z |
| [iaplot] [Up] [iashow] | Visualization |
Implemented in Python.
| x | Image. Gray-scale (uint8 or uint16) or binary image (logical).
x range. Default:
|
| y | Image. Gray-scale (uint8 or uint16) or binary image (logical).
y range. Default:
|
| z | Image. Gray-scale (uint8 or uint16) or binary image (logical).
object function (z=f(x,y)). Default:
|
| filename | String. Name of the postscript file. Default:
|
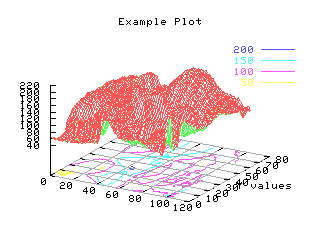
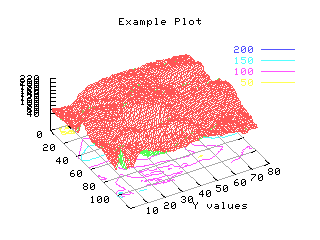
Plot a 3D function z=f(x,y).
>>> x = Numeric.arange(35)/2.0
>>> y = Numeric.arange(30)/10.0 - 1.5
>>> def z(x,y): return 1.0 / (1 + 0.01 * x**2 + 0.5 * y**2)
>>> g,d = iasplot(x, y, z)
>>>
|
|
| x, y, z |
def iasplot(x=0, y=None, z=None, filename=None):
    import Numeric
    try:
        import Gnuplot
        import Gnuplot.funcutils
        g = Gnuplot.Gnuplot(debug=1)
        g('set parametric')
        g('set data style lines')
        g('set hidden')
        g('set contour base')
        f = Numeric.asarray(x)
        if y is None:
            x = range(f.shape[0])
            y = range(f.shape[1])
            def z(x, y, f=f):
                return f[int(x),int(y)]
        d = Gnuplot.funcutils.compute_GridData(x, y, z, binary=0)
        g.splot(d)
        if filename:
            g.hardcopy(filename, mode='portrait', enhanced=1, color=1)
    except:
        g,d = None,None
    return g, d
| [iaplot] [Up] [iashow] | |