[ialblshow] [Up] [iasplot] | Visualization |
Implemented in Python.
Plot a 2D function y=f(x).
>>> import Numeric
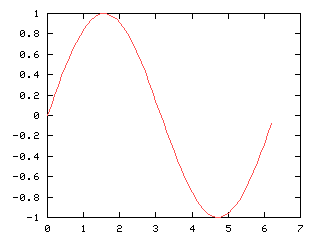
>>> x = Numeric.arange(0, 2*Numeric.pi, 0.1)
>>> y = Numeric.sin(x)
>>> g, d = iaplot(x,y)
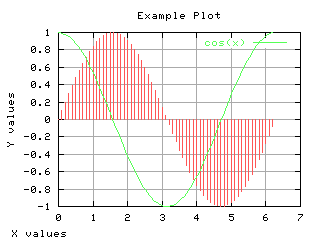
>>> g('set data style impulses')
>>> g('set grid')
>>> g('set xlabel "X values" -20,0')
>>> g('set ylabel "Y values"')
>>> g('set title "Example Plot"')
>>> g.plot(d, 'cos(x)')
>>>
x,y | d, 'cos(x)' |
def iaplot(x=0, y=None, filename=None): import Numeric try: import Gnuplot g = Gnuplot.Gnuplot(debug=1) g('set data style lines') x = Numeric.ravel(x) if not y: y = x x = Numeric.arange(len(y)) else: y = Numeric.ravel(y) d = Gnuplot.Data(x, y) g.plot(d) if filename: g.hardcopy(filename, mode='portrait', enhanced=1, color=1) except: g,d = None,None return g, d
[ialblshow] [Up] [iasplot] | |