[iaisolines] [Up] [ialblshow] Visualization

iadftview
Generate optical Fourier Spectrum for display from DFT data.

Synopsis

G = iadftview( F )

Implemented in Python.

Input

F Image. Gray-scale (uint8 or uint16) or binary image (logical).

DFT complex data. F(1,1) is the center of the spectrum (u,v)=(0,0)

Output

G Image. Gray-scale uint8 image.

uint8 image suitable for displaying

Description

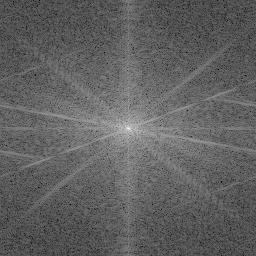
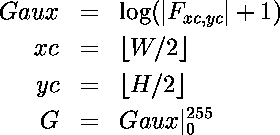
Generate the logarithm of the magnitude of F, shifted so that the (0,0) stays at the center of the image. This is suitable for displaying only.

Examples

Image and its Fourier Spectrum
>>> import FFT

              
>>> f = iaread('cameraman.pgm')

              
>>> iashow(f)
(256, 256) Min= 0 Max= 251 Mean=137.066 Std=87.20
>>> F = FFT.fft2d(f)

              
>>> Fv = iadftview(F)

              
>>> iashow(Fv)
(256, 256) Min= 50 Max= 255 Mean=128.205 Std=16.56
f Fv

Equation

Source Code

def iadftview(F):
    from Numeric import log, ravel, UnsignedInt8
    FM = iafftshift(log(abs(F)+1))
    G = (FM * 255./max(ravel(FM)))
    G = G.astype(UnsignedInt8)
    return G
    

See also

iadft Discrete Fourier Transform.
iaidft Inverse Discrete Fourier Transform.
iafftshift Shifts zero-frequency component to center of spectrum.

See also

[iaisolines] [Up] [ialblshow] http://www.python.org