Demo Script
Computing the normalized cumulative histogram (NCH)
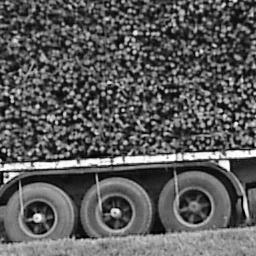
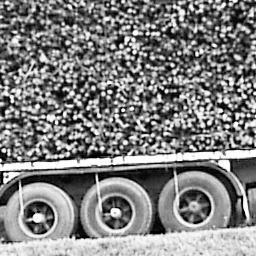
>>> f = iaread('woodlog.pgm')
>>> iashow(f)
(256, 256) Min= 0 Max= 255 Mean=91.026 Std=53.61
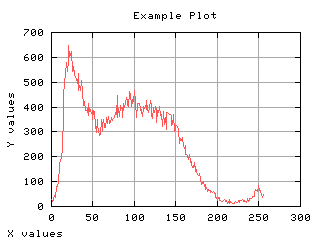
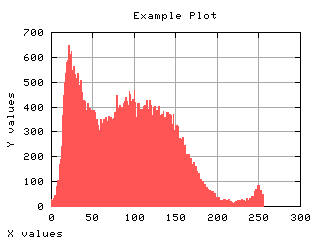
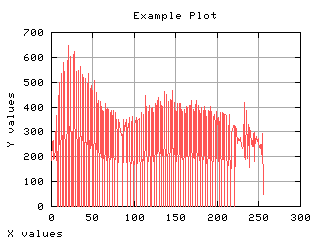
>>> h = iahistogram(f)
>>> g,d1 = iaplot(h)
>>> g('set data style boxes')
>>> g.plot(d1)
>>>
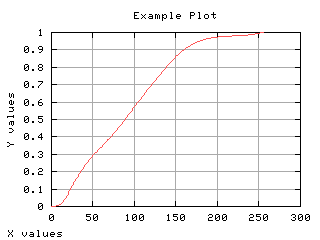
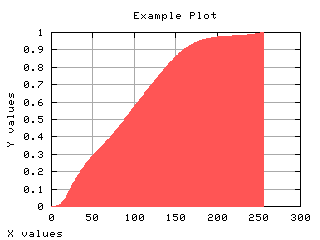
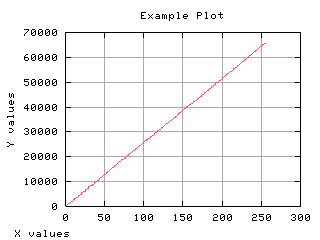
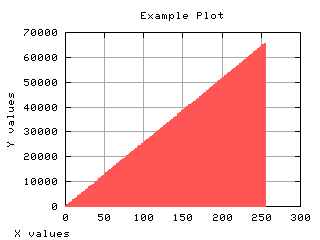
>>> nch = cumsum(h) / (1.*product(f.shape))
>>> g,d2 = iaplot(nch)
>>> g('set data style boxes')
>>> g.plot(d2)
>>>
 |
 |
|
| f | h |
 |
 |
|
| d1 | nch |
 |
|
| d2 |
Use the NCH as intensity transform
>>> gn = (255 * iaapplylut(f, nch)).astype('b')
>>> iashow(gn)
(256, 256) Min= 0 Max= 255 Mean=127.723 Std=73.49
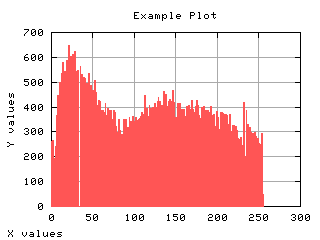
>>> gh = iahistogram(gn)
>>> g,d1 = iaplot(gh)
>>> g('set data style boxes')
>>> g.plot(d1)
>>>
>>> gch = cumsum(gh) # cumulative histogram
>>> g,d2 = iaplot(gch)
>>> g('set data style boxes')
>>> g.plot(d2)
>>>
 |
 |
|
| gn | gh |
 |
 |
|
| d1 | gch |
 |
|
| d2 |