Demo Script
Reading and ROI selection


Convolution with the Laplacian kernel
The image is convolved (periodicaly) with the 3x3 Laplacian kernel
>>> import Numeric
>>> fd = froi.astype(Numeric.Float)
>>> h = Numeric.array([[-2,-1,0],[-1,0,1],[0,1,2]])
>>> g = iapconv(fd,h)
>>> iashow(g)
(111, 111) Min= -308.0 Max= 391.0 Mean=0.000 Std=41.56
 |
|
| g |
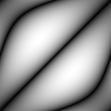
Equivalent filter in frequency domain
The 3x3 kernel is zero padded to the size of the input image and periodicaly translated so that the center of the kernel stays at the top-left image corner. Its spectrum is visualized.
>>> hx = Numeric.zeros(Numeric.array(froi.shape))
>>> hx[:h.shape[0],:h.shape[1]] = h
>>> hx = iaptrans(hx,-Numeric.floor((Numeric.array(h.shape)-1)/2).astype(Numeric.Int))
>>> H = iadft(hx);
>>> iashow(iadftview(H))
(111, 111) Min= 0 Max= 254 Mean=147.832 Std=66.87
 |
|
| iadftview(H) |
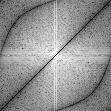
Filtering in the frequency domain
The image is filtered by multiplying its DFT by the frequency mask computed in the previous step.
>>> F = iadft(fd)
>>> G = F * H
>>> print "Is symmetrical:", iaisdftsym(G)
Is symmetrical: 1
>>> iashow(iadftview(G))
(111, 111) Min= 0 Max= 255 Mean=144.841 Std=41.62
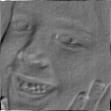
>>> g_aux = iaidft(G).real
>>> iashow(g_aux)
(111, 111) Min= -308.0 Max= 391.0 Mean=-0.000 Std=41.56
 |
 |
|
| iadftview(G) | g_aux |