Demo Script
Kernel images generated
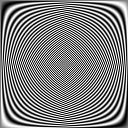
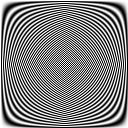
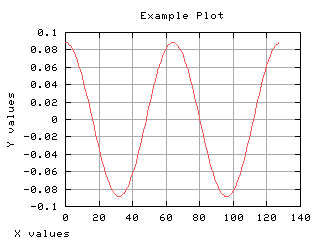
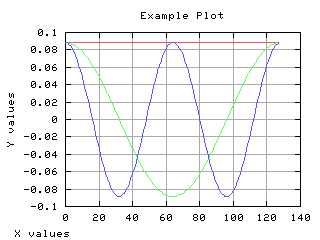
Three first lines
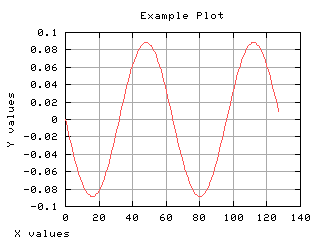
Three first lines from imaginary and real parts of the kernel matrix. Observe the increasing frequencies of the senoidals (imaginary part) and cossenoidals (real part).
>>> g,i1 = iaplot(Aimag[0,:])
>>> g,i2 = iaplot(Aimag[1,:])
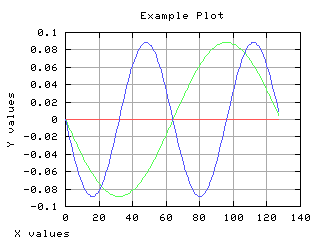
>>> g,i3 = iaplot(Aimag[2,:])
>>> g.plot(i1,i2,i3)
>>>
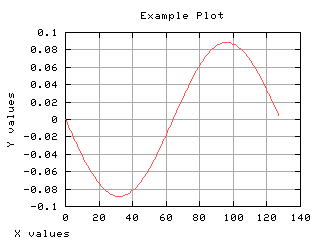
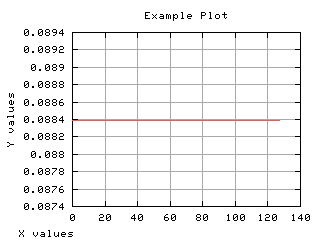
>>> g,r1 = iaplot(Areal[0,:])
>>> g,r2 = iaplot(Areal[1,:])
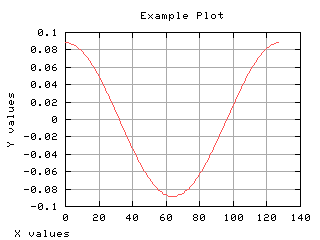
>>> g,r3 = iaplot(Areal[2,:])
>>> g.plot(r1,r2,r3)
>>>
 |
 |
|
| Aimag[0,:] | Aimag[1,:] |
 |
 |
|
| Aimag[2,:] | i1,i2,i3 |
 |
 |
|
| Areal[0,:] | Areal[1,:] |
 |
 |
|
| Areal[2,:] | r1,r2,r3 |