Examples
>>> f = [[0,1,2], [3,4,5]]
>>> it = Numeric.array(range(6)) # identity transform
>>> print it
[0 1 2 3 4 5]
>>> g = iaapplylut(f, it)
>>> print g
[[0 1 2]
 [3 4 5]]
>>> itn = 5 - it # negation
>>> g = iaapplylut(f, itn)
>>> print g
[[5 4 3]
 [2 1 0]]
>>> f = iaread('cameraman.pgm')
>>> it = 255 - Numeric.arange(256)
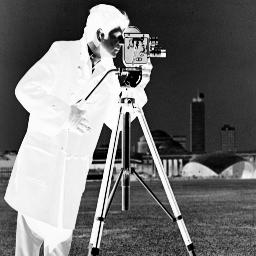
>>> g = iaapplylut(f, it)
>>> iashow(f)
(256, 256) Min= 0 Max= 251 Mean=137.066 Std=87.20
>>> iashow(g)
(256, 256) Min= 4 Max= 255 Mean=117.934 Std=87.20
 |
 |
|
| f | g |
>>> f = [[0,1,1], [0,0,1]]
>>> ct = [[255,0,0], [0,255,0]]
>>> g = iaapplylut(f,ct)
>>> print g
[[[255   0   0]
  [255 255   0]]
 [[  0 255 255]
  [  0   0 255]]
 [[  0   0   0]
  [  0   0   0]]]
>>> f = iaread('cameraman.pgm')
>>> aux = Numeric.resize(range(256), (256,1))
>>> ct = Numeric.concatenate((aux, Numeric.zeros((256,2))), 1)
>>> g = iaapplylut(f, ct)
>>> iashow(f)
(256, 256) Min= 0 Max= 251 Mean=137.066 Std=87.20
>>> iashow(g)
(3, 256, 256) Min= 0 Max= 251 Mean=45.689 Std=81.91
 |
 |
|
| f | g |